I happened to have an dataset of Car2Go vehicle locations in Vancouver and used Tableau to plot them by latitude and longitude.
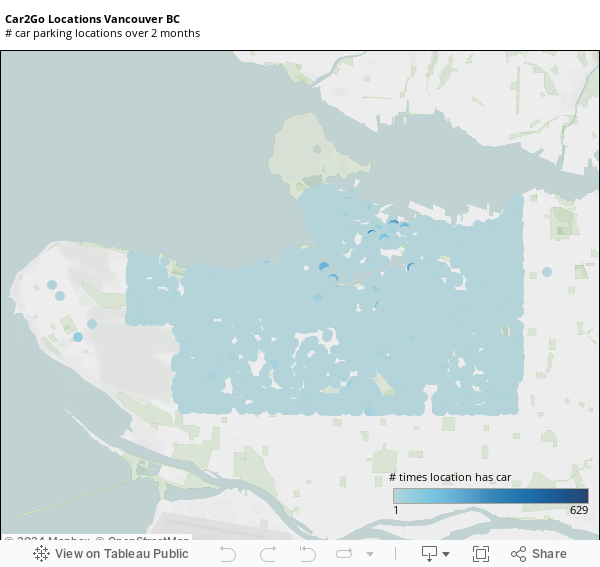
There are a lot of observations over the time data was collected. There are limited physical number of parking spots so cars are parked in locations that are very close to other car locations. This makes for a very dense plot.
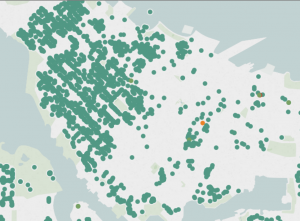
But if you zoom into the view the detail will resolve. For example below is a screenshot of a zoomed into downtown Vancouver. You can very clearly see that cars are parked along city streets. Fixed parking spots are identified by darker color.