I created a web application that included screenshots of about 190 country’s national statistics agencies website home page. I created the site to host the results of comparisons of each country’s website home page features.
One of the features I wanted to include was the top 5 colors used on each home page. For example here is an image of the Central Statistical Office of Zambia website home page.
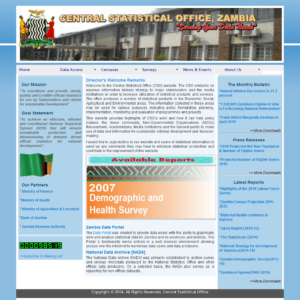
I wanted a list of the top 5 colors used in the web page, in my case I wanted these as a list of rgb color values that I could save to a database and use to create a color palette image.
For example the Central Statistical Office of Zambia website home page top 5 rgb colors were:
- 138, 187, 223
- 174, 212, 235
- 101, 166, 216
- 93, 92, 88
- 242, 245, 247
These 5 colors were not equally distributed on the home page and when plotted as stacked bar plot and saved as an image, looked like this: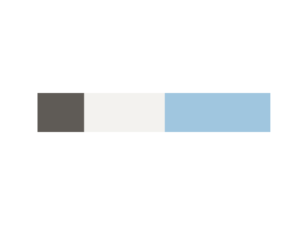
How to identify top 5 colors on webpage
Identifying dominant colors in an image is a common task for a variety of use cases so there was a number of options available.
The general technique essentially involves reducing an image to a list of pixels and then identifying each pixel’s color and the relative proportion of that color to all other colors and then taking the top 5 pixel counts to get top 5 colors.
However a web page can have many similar colors for example many shades of blue. So identification of colors involves a statistical categorization and enumeration to group similar colors into one category, for example, group all shades of blue into one ‘blue’ category.
There are a couple of different statistical methods to do this categorization that are discussed below.
Modified Median Cut Quantization
This method involves counting image pixels by color and charting them on a histogram from which peaks are counted to get dominant colors.
This method is used in a Python module called color-thief-py. This module uses Pillow to process the image and modified median cut quantization
I used this module in the code below where I loop through a folder of screenshots to open image and then pass it to color-thief-py to process. Then the top 5 colors’ rgb strings are written into my database as a list so they can be used later.
    import os, os.path
    from PIL import Image
    import psycopg2
    from colorthief import ColorThief

    conn_string = \
        "host='localhost' \
        dbname='databasename' \
        user='username' \
        password='userpassword'"

    conn = psycopg2.connect(conn_string)
    cur = conn.cursor()

    ## dev paths
    screenshots_path = 'C:/screenshots/'

    screenshots_dir = os.listdir(screenshots_path)
    for screenshot in screenshots_dir:
        if screenshot != 'Thumbs.db':
            img = Image.open(screenshots_path + screenshot)
            width, height = img.size
            quantized = img.quantize(colors=5, kmeans=3)
            palette = quantized.getpalette()[:15]
            convert_rgb = quantized.convert('RGB')
            colors = convert_rgb.getcolors(width*height)
            color_str = str(sorted(colors, reverse=True))
            color_str = str([x[1] for x in colors])
            print screenshot + ' ' + str(img.size[1]) + ' ' + color_str

            cur.execute("UPDATE screenshots \
            set color_palette = %s,  \
            height = %s \
            WHERE filename like %s", \
            (str(color_str),img.size[1], '%' + screenshot + '%',))
            conn.commit()

    cur.close()
    conn.close()
K-means clustering
Another statistical method to identify dominant colors in an image is using K-means clustering to group image pixels by rgb values into centroids. Centroid’s with highest counts are identified as dominant colors.
This method is used in the process I found on this awesome blog post on pyimagesearch.com.
This method also uses Python module sklearn k-means to identify the dominant colors. It produced very similar results to the other method.
This code from the pyimagesearch website used Python module matplotlib to create plot of the palette and saved these as images. I modified the code to instead simply save the rgb color values as strings to insert into database and save the matplotlib palette rendered plot as an image. I added plt.close() after each loop to close the rendered plot after the plot image was saved because if they aren’t closed, they accumulate in memory and crashed the program.
# USAGE
# python color_kmeans.py --image images/jp.png --clusters 3

# import the necessary packages
from sklearn.cluster import KMeans
import matplotlib.pyplot as plt
import argparse
import utils
import cv2
import os, os.path
import csv

# construct the argument parser and parse the arguments
#ap = argparse.ArgumentParser()
#ap.add_argument("-i", "--image", required = True, help = "Path to the image")
#ap.add_argument("-c", "--clusters", required = True, type = int, help = "# of clusters")
#args = vars(ap.parse_args())

screenshots_path = 'screenshots/'

screenshot_palette = list()

## Create csv file to write results to
file = csv.writer(open('palettes.csv', 'wb'))
file.writerow(['screenshot','palette'])

screenshots_dir = os.listdir(screenshots_path)
for screenshot in screenshots_dir:
    if screenshot != 'Thumbs.db':
        print screenshot

        # load the image and convert it from BGR to RGB so that
        # we can dispaly it with matplotlib
        image = cv2.imread(screenshots_path + screenshot)
        image = cv2.cvtColor(image, cv2.COLOR_BGR2RGB)

        # show our image
        #plt.figure()
        #plt.axis("off")
        #plt.imshow(image)
        #plt.close()

        # reshape the image to be a list of pixels
        image = image.reshape((image.shape[0] * image.shape[1], 3))

        # cluster the pixel intensities
        clt = KMeans(n_clusters = 3)
        clt.fit(image)

        # build a histogram of clusters and then create a figure
        # representing the number of pixels labeled to each color
        hist = utils.centroid_histogram(clt)
        bar = utils.plot_colors(hist, clt.cluster_centers_)
        #color_palette = utils.plot_colors(hist, clt.cluster_centers_)
        #print color_palette
        #row = (screenshot, [tuple(x) for x in color_palette])
        #screenshot_palette.append(row)
        #print row

        #print row[0]
        #print row[1]

        # show our color bar
        plt.figure()
        plt.axis("off")
        plt.imshow(bar)
        plt.show()
        plt.savefig('palettes/' + screenshot)
        plt.close()

        #file.writerow([
        #        row[0].encode('utf-8', 'ignore'),
        #        row[1],
        #        ])